Before You Start
- You need admin access to your Airbo board
- Navigate to the Reports tab in your board's left-hand menu
- Click on Tiles in the Reports sidebar to open the Engagement By Tile section
What Is the Engagement By Tile Report?
The Engagement By Tile report gives you a snapshot of how every tile on your board is performing. You can see how many people viewed each tile, how many link clicks it received, and how long it's been live.
This is your go-to place to understand what content is working and what might need a refresh.
Viewing Your Tile List
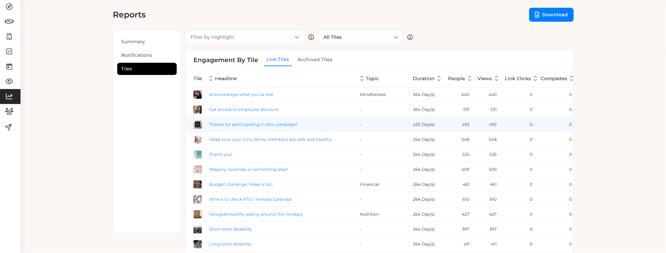
When you open the Engagement By Tile section, you'll see a table with all your tiles listed. Here's what each column tells you:
- Tile: A small thumbnail image of the tile
- Headline: The title of the tile (clickable to view more details)
- Topic: The topic tag assigned to the tile, if any
- Duration: How long the tile has been live on your board
- People: The number of unique people who interacted with the tile
- Views: The total number of times the tile was viewed
- Link Clicks: How many times people clicked on any links inside the tile
- Completes: The number of people who completed the tile (answered the question or clicked the action button)
- Engagement: A visual progress bar and percentage showing the completion rate. This is calculated based on how many people completed the tile out of those who viewed it. A higher percentage means more people are following through.
Tip: You can click the arrows next to column headers like People, Views, Link Clicks, Completes, and Engagement to sort the table. This is a quick way to find your top-performing or lowest-performing tiles.
Switching Between Live and Archived Tiles
At the top of the table, you'll see two tabs:
- Live Tiles shows all tiles that are currently active on your board.
- Archived Tiles shows tiles that have been archived.
Click the tab you want to switch between them. This is helpful when you want to review past campaign tiles and compare them with current content.
Filtering Tiles
You have two filter options at the top of the page to narrow down what you're looking at.
Filter by Highlight
- Click the Filter by Highlight dropdown at the top left.
- Select a specific highlight (campaign) from the list.
- The table will update to show only the tiles in that highlight.
This is great when you want to review performance for a specific campaign, like an Open Enrollment push or a Wellness Month highlight.
Filter by Tile Type
- Click the All Tiles dropdown at the top of the page.
- Choose from the following options:
- All Tiles shows every tile regardless of type
- Feedback Tiles shows only feedback-style tiles
- Survey Tiles shows only survey tiles
- Quiz Tiles shows only quiz tiles
- Q&A Tiles shows only question-and-answer tiles
What you'll see: The table refreshes to display only tiles that match the type you selected.
Tip: Combine both filters together. For example, select a specific highlight AND choose "Quiz Tiles" to see only quiz performance within that campaign.
Viewing Detailed Tile Stats
Want to dig deeper into a specific tile? Click on any tile's headline in the table. A Tile Stats popup will appear with much more detail.
The Analytics Tab
The Analytics tab is the default view and shows:
- Date Posted: When the tile was first published
- People Viewed: The total number of unique people who saw the tile
- People Completed: The total number of people who completed the tile (answered the question or clicked the action button)
- Engagement Graph: A timeline chart showing People Viewed and People Completed over time. This helps you see when most engagement happened and whether it trailed off.
Tip: The engagement graph is especially useful after sending a reminder. You can see if the reminder created a second spike in views and completions.
Question and Answer Breakdown
Below the graph, you'll see the tile's question and a breakdown of how people responded. For each answer option, you'll see:
- Answer: The text of each answer choice
- People: How many people selected that answer
- Percent: The percentage of completions for each answer
This is valuable for survey and quiz tiles. It shows you exactly what employees are thinking or how well they understand a topic.
Tile Link Tracking
At the bottom of the Tile Stats popup, you'll find the Tile Link Tracking section. This shows:
- Link: The URL that was included in the tile
- People Clicked: How many unique people clicked the link
- Total Clicks: The total number of clicks (including repeat clicks from the same person)
This helps you measure whether employees are taking the next step, like visiting a benefits enrollment page or a vendor website.
Activity Tab
The Activity tab shows you exactly who interacted with the tile and what they did. You'll see a table with:
- Date: When the person viewed or completed the tile
- Name: The employee's name (clickable to view their profile)
- Answers: The answer they selected or action they took
- Views: How many times that person viewed the tile
At the top left, there's a Live dropdown that lets you filter between live and archived activity.
If a tile has many responses, the results are paginated. Use the page numbers at the top right to browse through all responses.
Tip: This tab is great for following up with specific employees. For example, if you need to confirm that key team members completed a compliance tile, you can check here by name.
Message Tab
The Message tab lets you send a targeted email directly to people based on their interaction with the tile. At the top, you'll see a message like "Send a message to the 1,600 people who..."
You can customize the targeting with two dropdowns:
- First dropdown: Choose the interaction type, such as "answered" or "have not answered"
- Second dropdown: Choose "the Tile" to target based on this specific tile
Below that, you can compose your message:
- Subject: Enter your email subject line
- Message: A rich text editor with formatting options including bold, italic, underline, text alignment, numbered and bulleted lists, font color, highlighting, links, Insert Name (to personalize), and Airbo Link (to link back to the board)
At the bottom, you have two buttons:
- Send Test: Sends a test version of the email to yourself so you can preview it before sending
- Send Email: Sends the email to the targeted group
Tip: Use this to nudge employees who haven't completed a tile yet. Select "have not answered" and send a friendly reminder with a direct link back to the board.
Sent Tab
The Sent tab shows a history of any targeted messages that have been sent from this tile. You'll see a table with:
- Data Sent: The date the message was delivered
- Subject: The subject line of the email
- Rule: The targeting rule that was used (for example, "have not answered the Tile")
- Recipients: How many people received the message
If no messages have been sent from this tile, you'll see a note that says "No targeted messages have been delivered for this Tile."
Note: This is different from post-level messages. The Sent tab only tracks messages sent directly from the Tile Stats popup using the Message tab.
Tips for Success
- Check your top performers: Sort by Views or People to find your most-viewed tiles. Use these as inspiration for future content.
- Watch for low engagement rates: If a tile has a high number of views but a low engagement percentage, the content or question might not be compelling enough. Consider revising the tile's headline or supporting content.
- Watch for low link clicks: If a tile has lots of views but very few link clicks, the call-to-action might need to be clearer or more compelling.
- Review quiz answer breakdowns: If many people are getting a quiz answer wrong, that topic might need extra communication or a follow-up tile.
- Use filters to compare campaigns: Filter by different highlights to see which campaign drove the most engagement across its tiles.
- Download the data: Click the Download button in the top right corner to export your tile data for use in reports or presentations.
Troubleshooting
I don't see any tiles in the report. Make sure you have tiles that are live on your board. If all your tiles are in draft or plan status, they won't appear in the Live Tiles tab. Check the Archived Tiles tab if you're looking for older content.
The People and Views columns show 0. This means the tile hasn't been viewed yet. Confirm that the tile is part of a published post and that a message has been sent to employees.
I can't find a specific tile. Try clearing your filters. If you have a highlight or tile type filter active, the tile you're looking for might be hidden. Set both dropdowns back to their default options.
Related Articles
Need more help? Contact support@airbo.com